Earlier this week, I was debugging and I was reminded of the sheer power of the XCode developer tools, even in the context of a not-quite-native application like a titanium application.
The Problem
Andrew was working on an application that will load in a large number of images and PDFs from a remote server and display them to the user, in-app. However, when we got to the point that we would be displaying a certain one of our images, we saw this in the Titanium console:[ERROR] invalid image type. expected TiBlob, String, TiFile, was: TiBlob -[TiUIImageView setImage_:](TiUIImageView.m:687)
Sorry, what? It seems like something odd is happening at a native level, and Titanium is getting too confused to return a sensible error message. Well, guess it’s time to open a support ticket with Appcelerator and wait for them to figure out what the issue could be, right?
Wrong. One of my favorite things about Appcelerator Titanium is its open-source nature. What we can do from here, is open up the native project generated by Titanium and debug it with the normal native debugging tools. When you build a Titanium application for iOS, a (pretty much) normal XCode project is generated from your project, compiled, and run on whatever test device you have selected. In situations like this, we can take that project and manually re-build it in XCode for debugging purposes.
Opening your project in XCode
To open your project in XCode, first runti build -p ios –build-only
in your project’s directory. This will ensure you have a native project generated for your Titanium project. From here, all you need to do is open XCode, and open up the XCode project in the build/iphone folder.

Setting Native Breakpoints
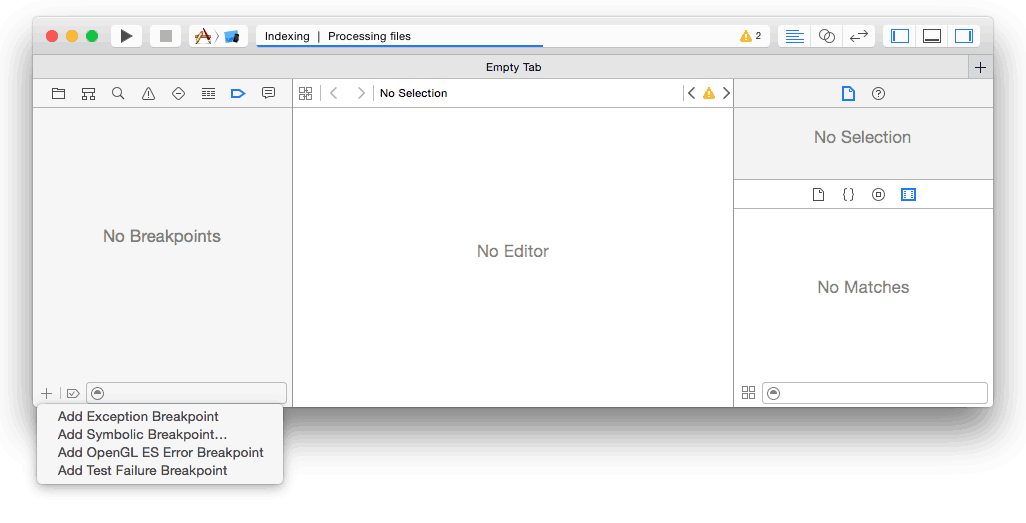
Now that we’ve got the project in XCode, we need to set up a native breakpoint so that we can see what the issue is with the Objective-C code that Titanium is executing on our behalf. Fortunately, the message that Titanium printed out gave us a selector name:-[TiUIImageView setImage_:]
. Let’s go ahead and set up a symbolic breakpoint for that selector:


Enter the XCode debugger
Now that we’ve got our breakpoints set up, we can run the project in XCode, and execution will stop when our breakpoint is hit in the Titanium SDK code.

Let’s go ahead and step over a few commands and see if we can figure out exactly what’s going wrong.

Huh, it looks like we’re having some issue turning our Titanium file into a UIImage that we can apply to the native UIImageView. Let’s use the variable inspector to figure out exactly why we’re failing to convert this into an iOS image.

Well, one look at the MIME type is enough to see exactly what’s wrong. Our file isn’t an image! Even though this didn’t tell us exactly where the issue was, it was enough to direct our debugging (we eventually figured out that we were accidentally saving a PDF file as an image – oops!). Issues like this are why I’m very quick to reach for XCode when I see a native iOS issue – it makes it much easier to figure out what parts of your code might be incorrect when you can easily trace through Appcelerator’s code!
Sign up for the Shockoe newsletter and we’ll keep you updated with the latest blogs, podcasts, and events focused on emerging mobile trends.